
TL;DR
- Over 20 trading days, a value-investing screener read 2,691 entries off the WSJ list of new 52-week lows and rejected 92% before scoring anything.
- The model never writes a number. Python filters, scores and does the arithmetic; the model only explains numbers that were already computed.
- Most of the engineering went into the ways financial data misleads you: negative equity, distorted ratios, unadjusted splits, wrong tickers.
- It’s a triage, not a recommendation, and the scoring weights are still preliminary.
Over 20 trading days this autumn, a value-investing screening workflow we built read 2,691 entries off the Wall Street Journal’s daily list of new 52-week lows. It rejected 2,473 of them before scoring anything. It fully analyzed 218, which came to 81 unique companies, and 23 of those scored 8 out of 12 or better, enough to earn a closer look at who owns them.
The AI didn’t produce a single one of those numbers.
If you’ve used a language model for real work, you know the moment. The answer reads beautifully, you check one figure, and it’s wrong, stated with exactly the same calm as everything around it. A made-up adjective is a nuisance. A made-up number in a financial analysis is a liability, because it looks identical to a real one.
So we didn’t try to make the model better with numbers. We took the numbers away from it.
#Most of the work is saying no
The pipeline is easy to describe. Every trading day the system takes the WSJ list (stocks that just hit their lowest price of the past year, the classic hunting ground for value investors) and strips out anything that isn’t a US common stock above $2B in market cap. For what’s left, it pulls three years of annual income statements and balance sheets from Financial Modeling Prep, a financial data API, and scores each company on 11 criteria in the style of Benjamin Graham: profitability, solvency, price against book value. The output is an HTML report, ranked, with a pass or fail shown on every threshold.
The number that surprised us was 92%. That’s the share of entries that never reached scoring. 1,580 weren’t common stock at all: notes, bonds, preferred shares, closed-end funds, ETFs, warrants and SPACs all land on the same list. Another 796 sat under the $2B floor, which we chose because larger companies have more reliable data and more liquidity. 48 were non-US companies or ADRs. 25 had tickers we couldn’t confirm, so we excluded them rather than guess. The remaining 24 were manual exclusions. (These are daily appearances, so the same bond can turn up on several days.)
A screener earns its keep in the discipline of that funnel far more than in the scoring formula. And the funnel is audited by the code itself: on every run, analyzed plus excluded must equal the length of the WSJ list. Nothing disappears without a stated reason, and every exclusion is listed in the report next to its reason.
#Rule zero: the model never writes a number
The project runs on a rules document of about 5,800 words. It’s the agent’s operating instructions and the methodology spec at once, with a short note on why next to each rule. The first rule is marked as having no exceptions: use only data from the configured sources, meaning the financial API and the WSJ list. Never fill in, estimate or “remember” a figure about any company.
That word “remember” is the whole problem in miniature. A model trained on the open web has seen plenty of balance sheets, and it will happily quote one from memory. The figure is stale at best, and you have no way to tell how stale.
Everything else follows from that rule. Filtering, scoring and every piece of arithmetic run in Python: same input, same output, every time. Language models still get arithmetic wrong now and then; Python doesn’t. The model gets one job, which is writing plain-language explanations of numbers that were already computed and validated. Each number in its text has to be findable in the source data table, with the exact value cited next to the claim. When a field is missing, the report says “data unavailable”. A visible gap is safer than a guess that looks right.
Two quieter decisions carry a lot of weight. Raw API responses are saved as JSON, so we can regenerate a report with different weights without re-querying and without the data shifting between runs. And market cap comes from one timestamped snapshot per run, so every row in a report describes the same moment.
The usual instinct with AI is to make it smarter. We made it narrower. That division of labor is where the reliability comes from.
#When the data lies
Taking the numbers away from the model didn’t make the numbers right. It moved the risk somewhere we could see it: into the data. Most of the real engineering went into cataloguing the ways financial data misleads you. Four cases from our test runs show the pattern. They’re data-quality examples, not opinions on the stocks.
AutoZone has negative shareholder equity, and the data provider returns its price-to-book ratio as 0 or empty. A naive filter reads “P/B of 0, under the limit of 10, pass” and files it as cheap. Our rule now: negative equity disqualifies a company outright.
Clorox came back with a P/B around 129×. The stock isn’t expensive; the ratio is dividing by an equity figure close to zero. Rule: flag the distortion, never read it as a valuation.
Adient looked cheap on the balance sheet, with book value at or above the share price, while losing money. That’s the classic shape of a value trap. Rule: cheapness only counts alongside profitability, and the report says “possible value trap” in so many words.
Stifel did a 3:2 stock split on 27 February 2026, after its fiscal-year report, and the provider didn’t always adjust for it. Share count, book value per share and EPS ended up on a different basis than the price. Worse, the resulting 1.5× error slipped under the 2× sanity check we already had. Rule: any split after the fiscal year end marks the data as suspect.
“Suspect” is now a defined state in code. A company gets it when our computed P/B and the provider’s differ by more than 3×, when book value is more than 5× the price, when EPS and net income divided by shares disagree by more than 3×, when the reported share count and market cap divided by price disagree by more than 2×, or when a split landed after the fiscal year end. A suspect company loses the 3 points for book value at or above price (the heaviest weight in the scoring) and the bonus for the “sweet spot” where book value is 1 to 2× the price. Anything showing a discount of 2× or more gets a separate flag, “extreme discount, verify”, and no reward. More often than not, that’s a data error rather than a bargain.
Even tickers are treated as proposals, not facts. A wrong ticker silently brings in another company’s numbers, and nothing downstream would notice. So every ticker is checked against the data provider for a US exchange and a matching name. Ambiguous cases are settled by matching the price to WSJ’s closing price within half a cent. If that fails, the company is out as “ticker not confirmed”, which happened 25 times in 20 runs. Confirmed matches are kept, 311 of them so far.
Hand any one of these cases to an unconstrained model and you get a confident, fluent, wrong sentence. “Trades at zero times book value” reads perfectly well.
#A triage, not a recommendation
The system sorts. It doesn’t recommend, and its role definition says so plainly: no investment recommendations, only a triage on explicit criteria. A person makes the call.
We’re equally plain about what isn’t finished. The scoring weights are preliminary. The method still needs review by someone experienced with financial data, and the rules spell out the first sanity check: known-good companies should rank high, negative-equity companies low. The rules document has a section called “decisions still open” that lists the provisional parts, from penalty sizes and thresholds to annual versus quarterly balance sheets and total versus tangible book value. Every report repeats the caveats that matter, among them that banks and REITs are scored mechanically (Graham’s method doesn’t fit them cleanly) and that analyst targets are opinions, often optimistic ones. We see that honesty as part of why the thing can be trusted, not as small print.
Human judgment also has a fixed place to live. A plain-text decisions file is read on every run, applied before the defaults and shown in the report. Today it holds the 311 confirmed ticker mappings, 5 manual exclusions of closed-end funds, 3 manual inclusions of companies domiciled outside the US, a new filter pattern and a confirmed gap check. When a person overrides the machine, you can see it.
Some data is shown purely as context and never touches the ranking. Analyst price targets appear as “analyst consensus”, never as a prediction, with the upside computed in code and a “weak coverage” flag when fewer than 3 targets came in during the quarter. For the companies scoring 8 or more (at most 8 per report), code also gathers ownership: the top institutional holders and how their positions moved over the quarter, plus six months of insider trades from SEC Form 4 filings. Sales under pre-scheduled 10b5‑1 trading plans are counted separately, because a sale planned months ahead isn’t a signal.
This is where the anti-fabrication check is strictest. Every extracted value carries its source URL, the date it was collected and the exact snippet of raw response it came from. Code then verifies that the value actually appears in that snippet. If it doesn’t, the value is thrown out and the report shows “data unavailable”. The language has guardrails too. No “smart money is buying”, no “positive signal”: big funds hold a lot of companies for indexing reasons, not out of conviction.
#A paper test, so far
A screener that only grades itself proves nothing, so we gave it an outside scorekeeper. On 9 October we opened a demo portfolio in Yahoo Finance and bought companies with play money, using the same buy thresholds the screener applies. We’re keeping the holdings to ourselves; the point here is the scorekeeping, not the picks.
At its peak, the portfolio showed an unrealized gain of 13%. On 14 November it stood at 8.52%. A few positions were closed along the way, also at a gain.
Over the same stretch, the S&P 500 went the other way. It closed at 7,811.54 on 9 October and at 7,561.67 on 13 November, a drop of 3.2%. That’s a gap of almost 12 percentage points, and we’d be breaking our own rules if we made more of it than it is. It’s five weeks of paper trading, and the index figure leaves out dividends. We’re keeping the portfolio running, and the comparison will stay in every update, flattering or not.
What we can say with confidence is where both figures come from. Yahoo calculated ours from the positions we entered, the index levels came from a market data provider, and the model touched neither.
#Even the boring step has to prove itself
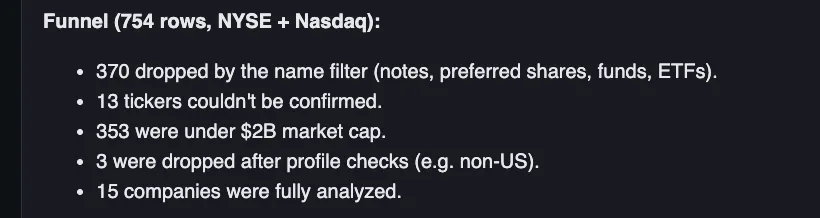
Until this week, the daily WSJ list came in as screenshots. The list for 13 November took six overlapping screenshots, deduplicated by hand, and the report carried a standing warning about “possibly untranscribed rows” until a human confirmed nothing was missing.
On 14 November we replaced that step. Claude now reads the WSJ page directly in Chrome, pulls the lows table from both the NYSE and Nasdaq tabs, and checks the row count against the count in WSJ’s own header. A separate import script refuses to write the list if the numbers don’t match, and the previous list is backed up first. The first run got 306 of 306 rows on NYSE and 448 of 448 on Nasdaq: 754 rows, where we used to cover NYSE alone at about 222.
One detail from that run says more about the design than any rule. The agent ran into a browser setting about download permissions. It didn’t change the setting on its own. It stopped and left that decision to a person.
The whole system is about 2,400 lines of Python, built with Claude Code, plus that rules document. The model was Claude Opus 5.5. None of it is exotic. What makes it work is that every part had to answer the same question before we trusted it: where exactly did this number come from, and can you show me?
Put that question to the next AI analysis that impresses you. If it can’t point to a row in a table, you’re reading a guess with good grammar.